How to Use the Map
Please see below for a map and corresponding key, as well as detailed information on each feature.
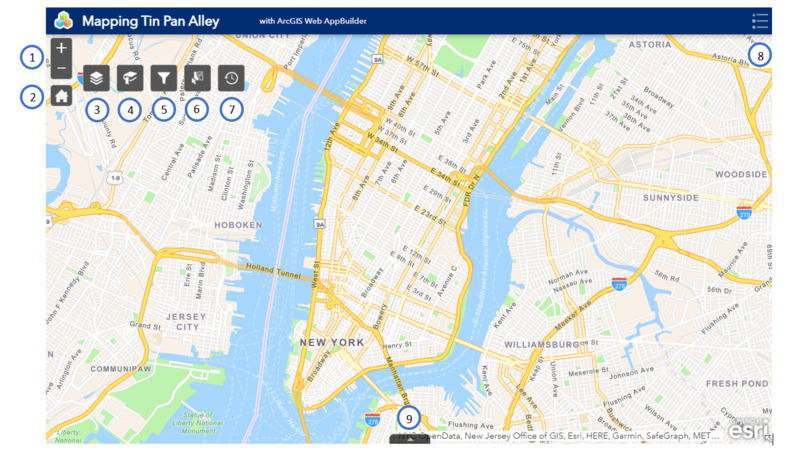
- Zoom in/zoom out
- View default map extent (Manhattan)
- Layers
- Bookmarks
- Filter
- Select
- Enable/disable time
- View legend
- View attribute table (essentially, an excel document with raw data for the map)
Layers
Data in the map is categorized into different categories called layers. There are 11 layers in the map, and layers 1-10 are time-enabled.
- Smaller publishers (these are sheet music publishers that published below 30 songs per year)
- Larger publishers (sheet music publishers that published above 30 songs in any year)
- Performance venues
- Black owned or controlled venues
- Stations on the 1904 IRT subway system
- Stations that were added to the subway after the original IRT system
- Stations on the Manhattan Elevated Railway
- Lines of the 1904 IRT subway
- Lines added after 1904
- Lines on the Manhattan Elevated Railway
- Modern subway system, color coded and not in time-scale
You can turn on or off any combination of layers by checking or unchecking the box to the left of the layer title. You can click on any object in the map to see a pop-up with information about that publisher or venue (Note: rather than creating a single datapoint for each publisher based on their known years of operation (the process for plotting venues), data points were only plotted based on the songs in the Levy Collection. Therefore, a publisher datapoint will disappear in time-enabled mode if there are no songs in the collection published that year).
Bookmarks
The map has five pre-selected bookmarks that show popular or important locations within the map. You can also add your own bookmark by scrolling to the desired location, clicking "add," and entering a title for your bookmark. Bookmarks you create are not visible to others.
Filter
This tool allows you to filter out data on the map to show only the data you would like. To create a filter:
- Click the button on the bottom right of the filter box
- Choose which layer you would like the filter to apply to. The filter you create will only affect this layer, but you can create multiple filters that operate simultaneously.
- Choose whether you'd like to create a single expression or a set of expressions
- You'll see two drop-down menus and a text field. In the first drop-down menu, choose which field (aspect of the data in that layer) you'd like to filter. For example, a useful field in the "Smaller Publishers" layer is called "Publisher name"
- Choose the qualifying phrase in the next drop-down menu-- I would recommend using "contains" rather than "is" as it is more open-ended.
- In the blank field below the second drop-down menu, enter the text that you would like to filter. For example, if you type "G. Schirmer," the map will only show publishers called "G. Schirmer"
- You can toggle each filter on or off using the green/white button at the upper right of the filter box
Select
This tool can be used to select data points to view them or export them. Use a pointer, rectangle, circle, or other select options to choose which data points you'd like to view. If you'd like to view or export the data for a layer, click the three dots to the right of the layer.
Time
This map spans 1880 to 1940. Rather than viewing all of the data at once, you can enable the time feature to view data from any time period you wish, from a single year to a time range. Once you have selected a year or range, you can click the 'play' button to move time forward. You can also click on the '1x' button to speed up or slow down time.